Infographics
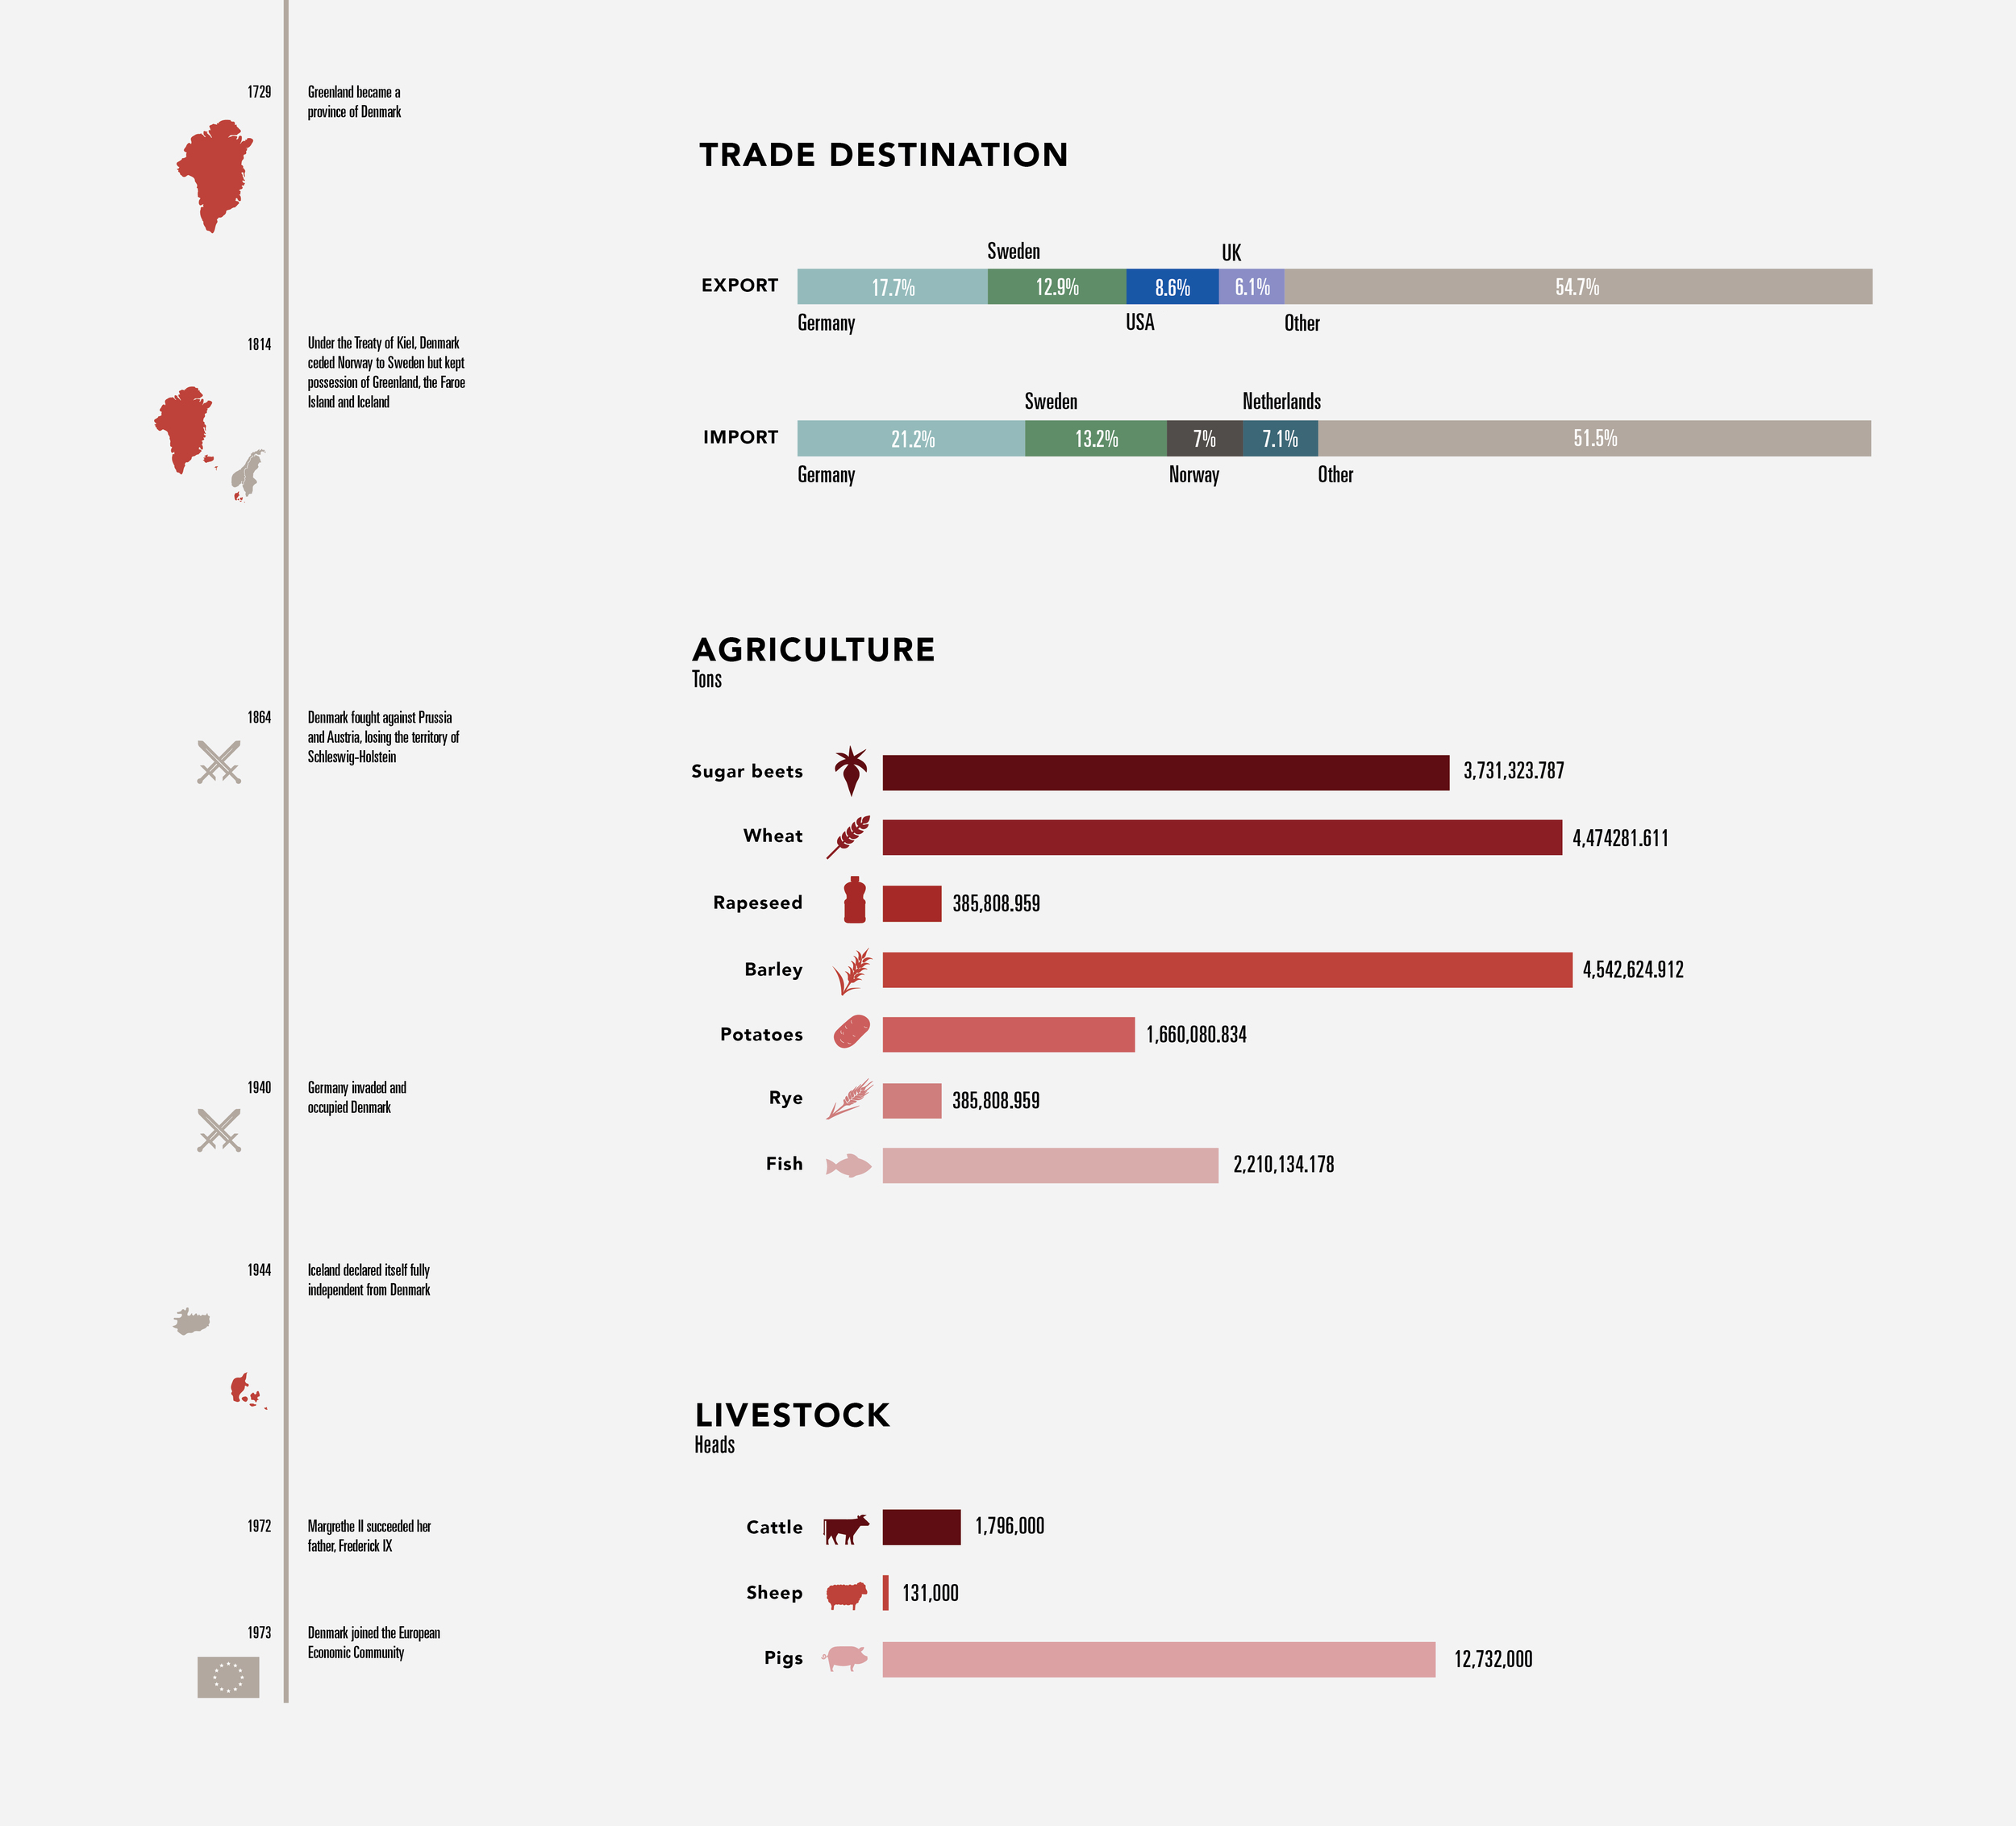
Denmark
This info graphic depicts the population, age, communication, population density, energy consumption, export, size, agriculture, livestock, and a brief history timeline of Denmark.


One Week Data Usage
An infographic depicting the amount, in hours, of how much a student uses different types of data on different days for one week.
Our Services
An infographic created for Saturday Brand Communications to organize all the services they have to offer.